KT Charts / Normative Datasets Comparison
Normative data can be powerful in the right hands. It immediately informs as to whether the objective data you are collecting is average, below-average, or above-average relative to the target population. How this information is then used has a wide range of applications from the strength training room to the athletic training / medical room. In many cases, normative data can inform the practitioner as to where an athlete sits from a performance and injury risk perspective and then provide updates as to whether intervention programs are changing the athlete profile appropriately.
In the case of the normative data and KangaTech, this is the first time that an extensive cross-section of reliable isometric strength data has been captured. In addition to understanding between limb and within-limb strength balance for a given athlete, practitioners can now compare their athlete’s strength in critical regions to a league-wide average. This additional layer of benchmarking assists coaches, performance, and medical staff in the individualization of player development programs.
To begin comparing your athletes to normative datasets please follow these steps:
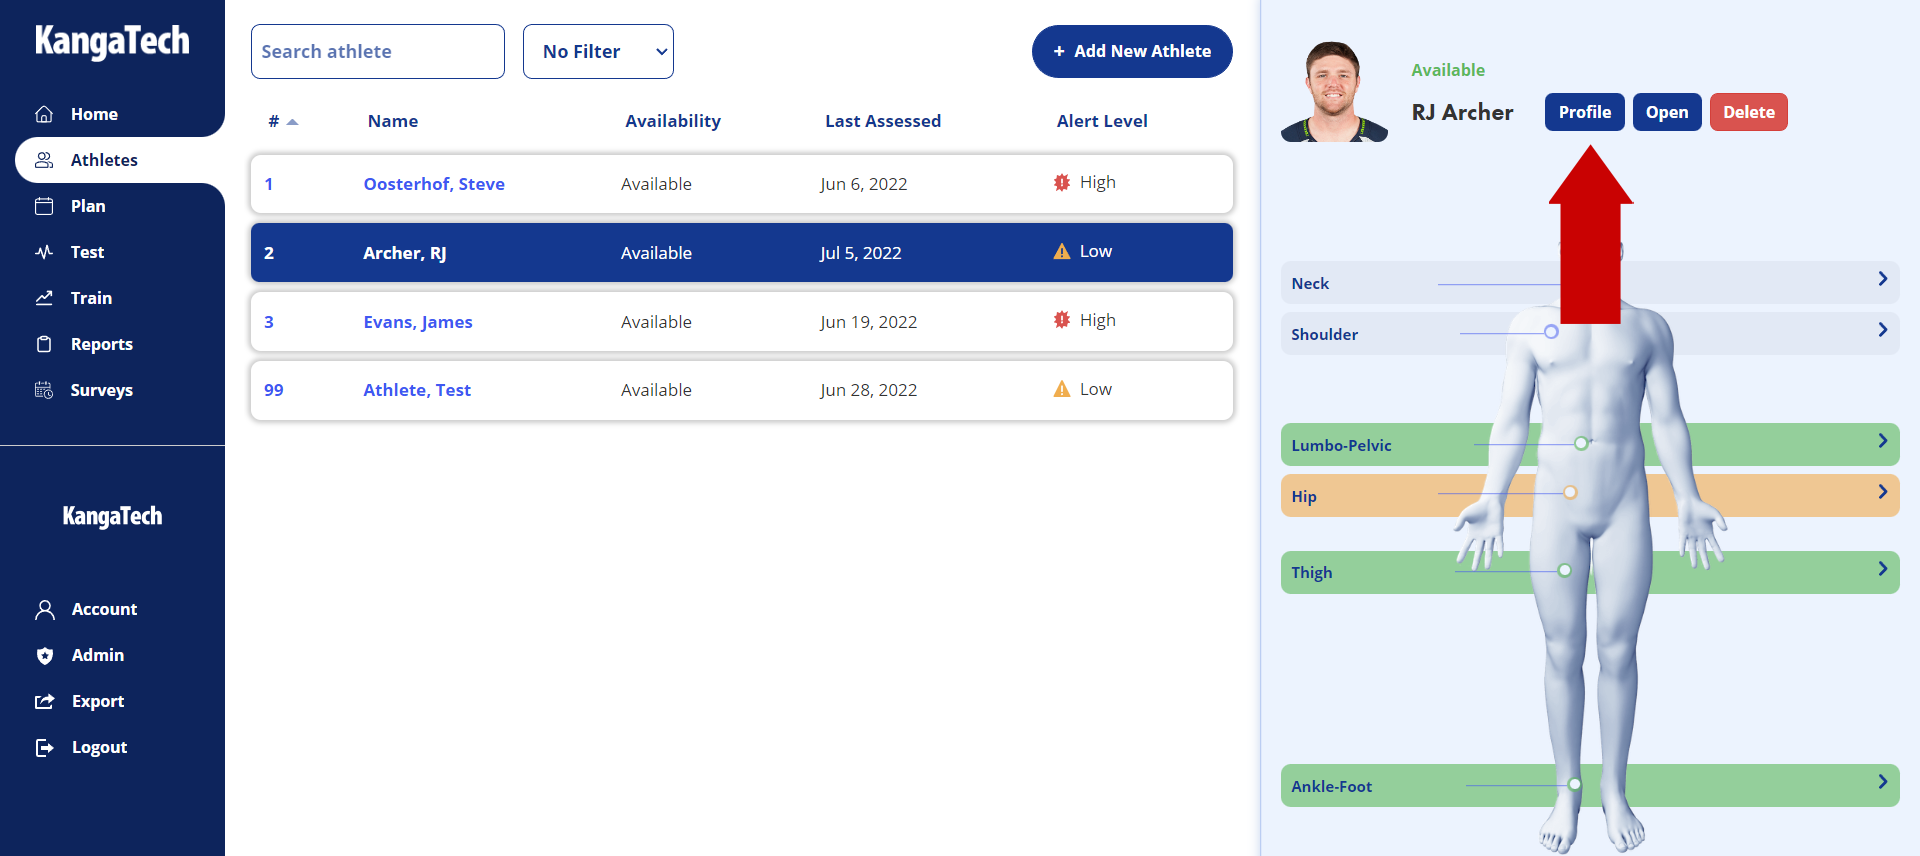
- Open Athletes Tab listed on the left-hand panel.
- Select the athlete you wish to compare with the normative data.
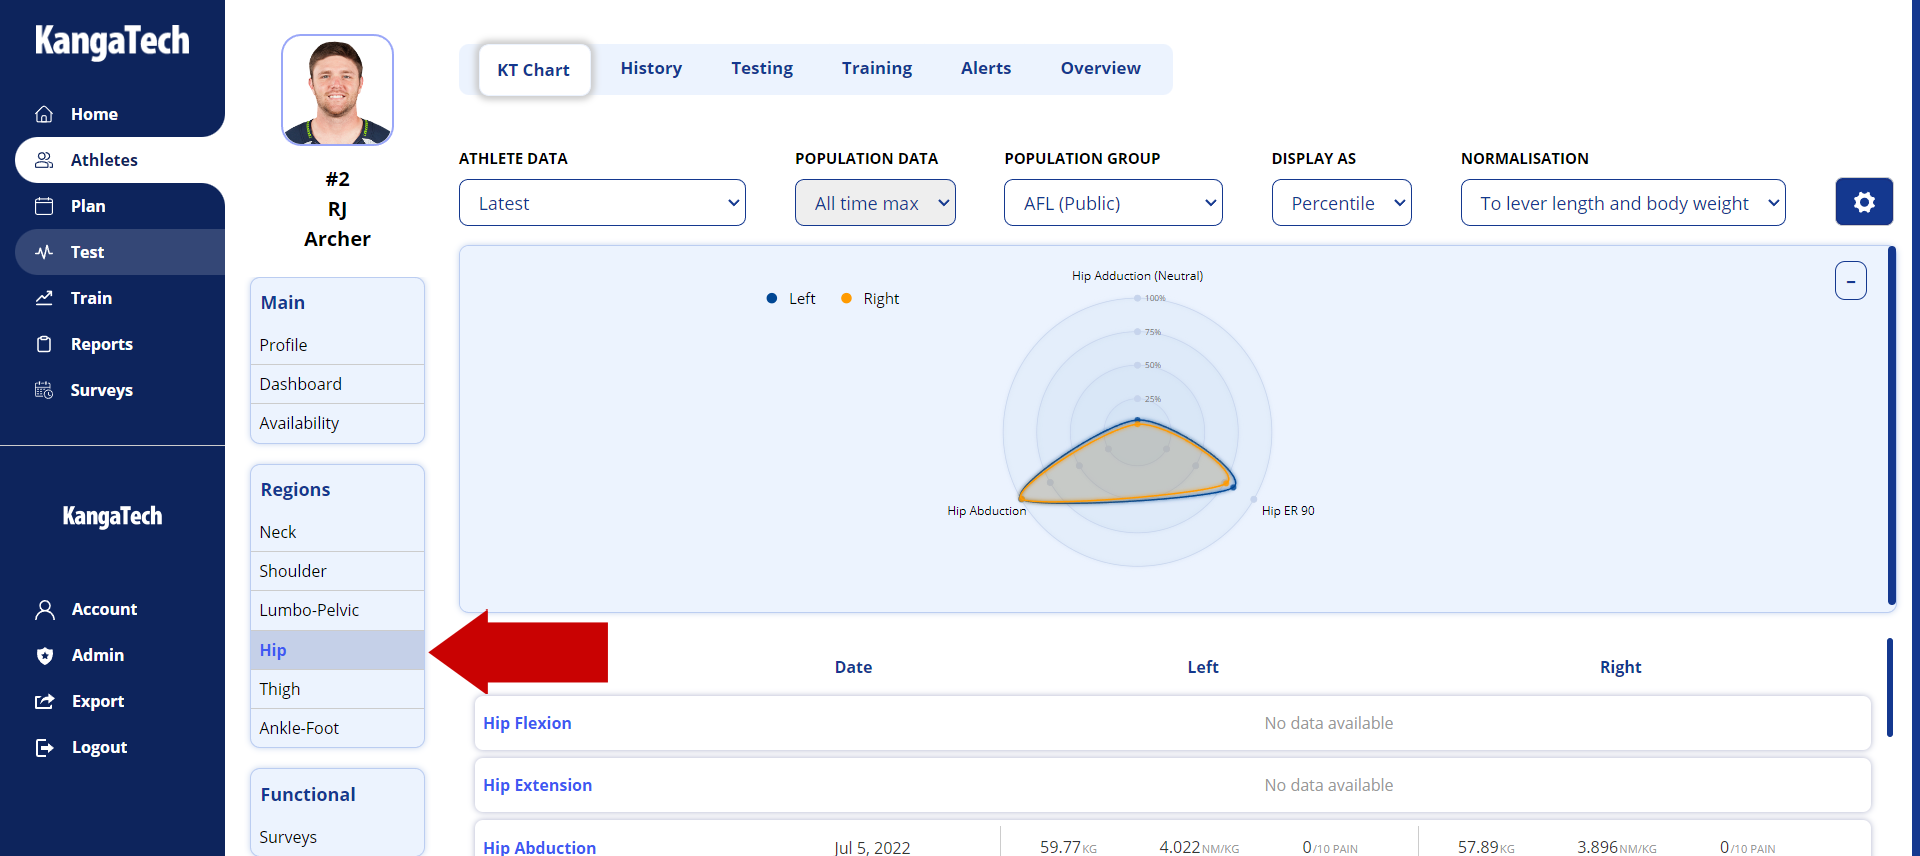
- Select the region you wish to compare.
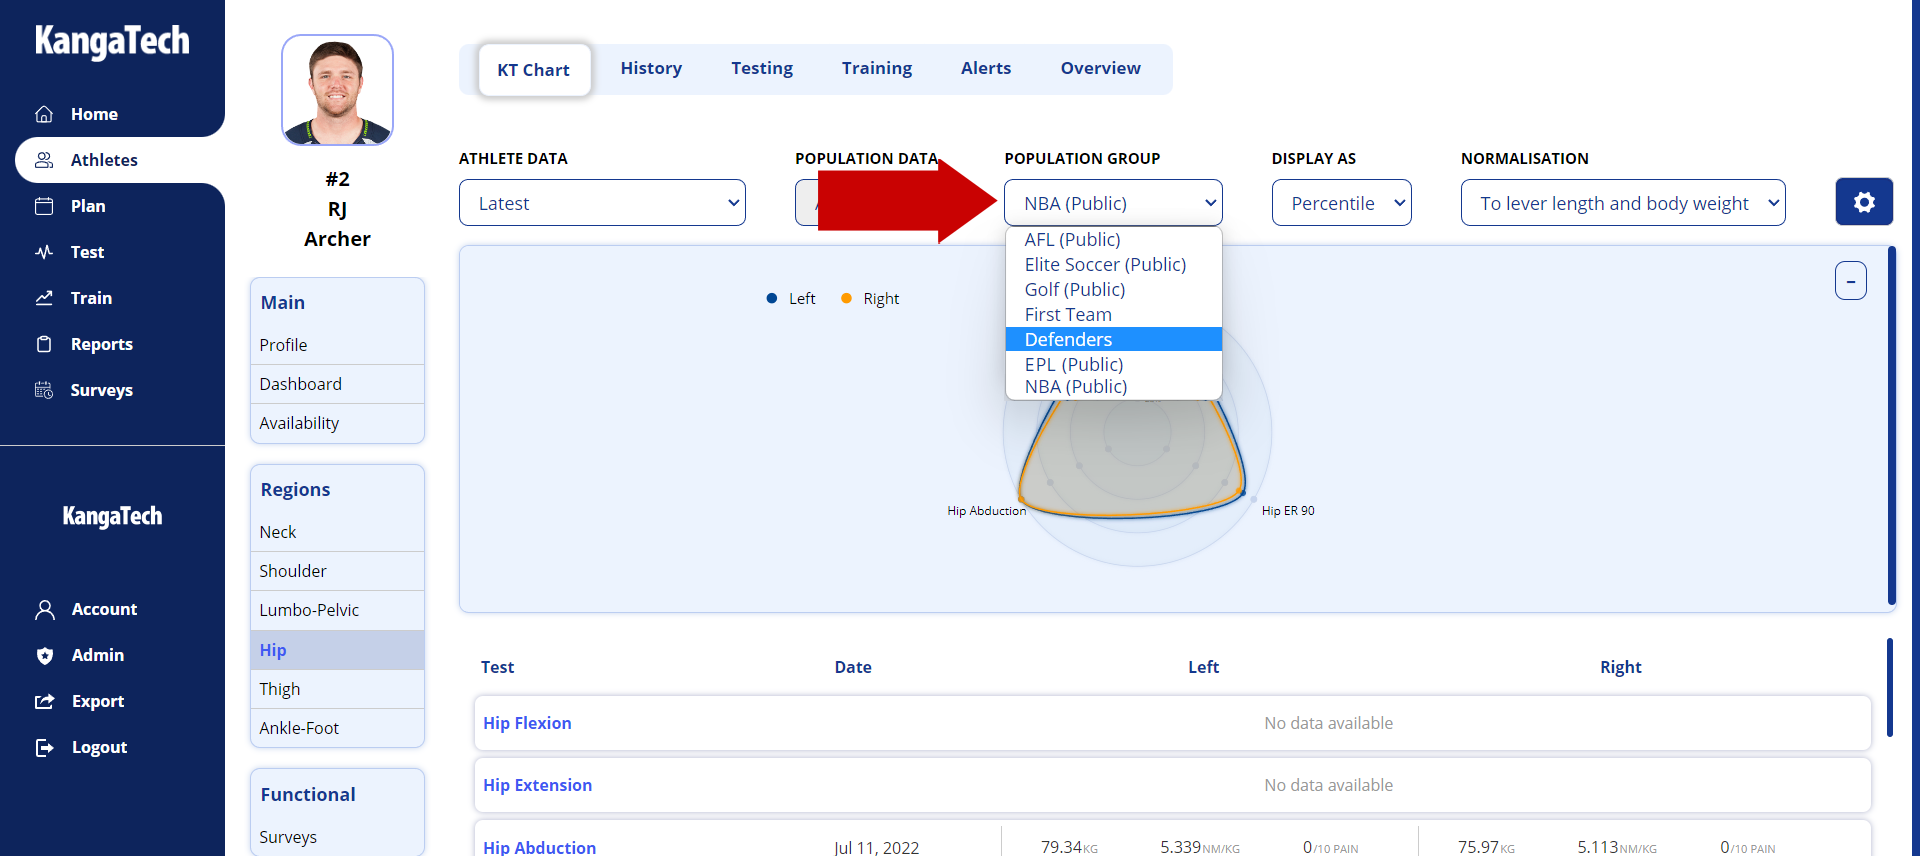
- While viewing the KT chart, select the drop-down menu under Population Group and select the normative dataset you would like to see your athlete compared to.